Watch every endpoint.Sleep like every endpoint is up.
Owl Ping checks your sites and APIs every minute, tracks response time over weeks, and pings you on email & WhatsApp the moment something breaks — with a public status page you can share with customers.
Know the moment your API goes downBefore your users do.
Owl Ping monitors your APIs and websites every minute, tracks response time, and pings you the second something breaks.
Email & WhatsApp alerts
Instant notifications the moment a check fails, plus reminders while the incident is open and a recovery ping when it’s back.
Response-time history
Live latency charts and a 30-day timeline of every check — spot regressions before they become outages.
Reports & uptime history
Per-monitor uptime %, incident history, and exportable reports for SLA reviews.
Public status pages
One-click hosted status page so customers always know the current health of your services.

Monitor dashboard
One screen for every monitor’s health
Each monitor gets a live dashboard with current status, uptime over multiple windows, and a complete incident timeline — no clicking around to piece things together.
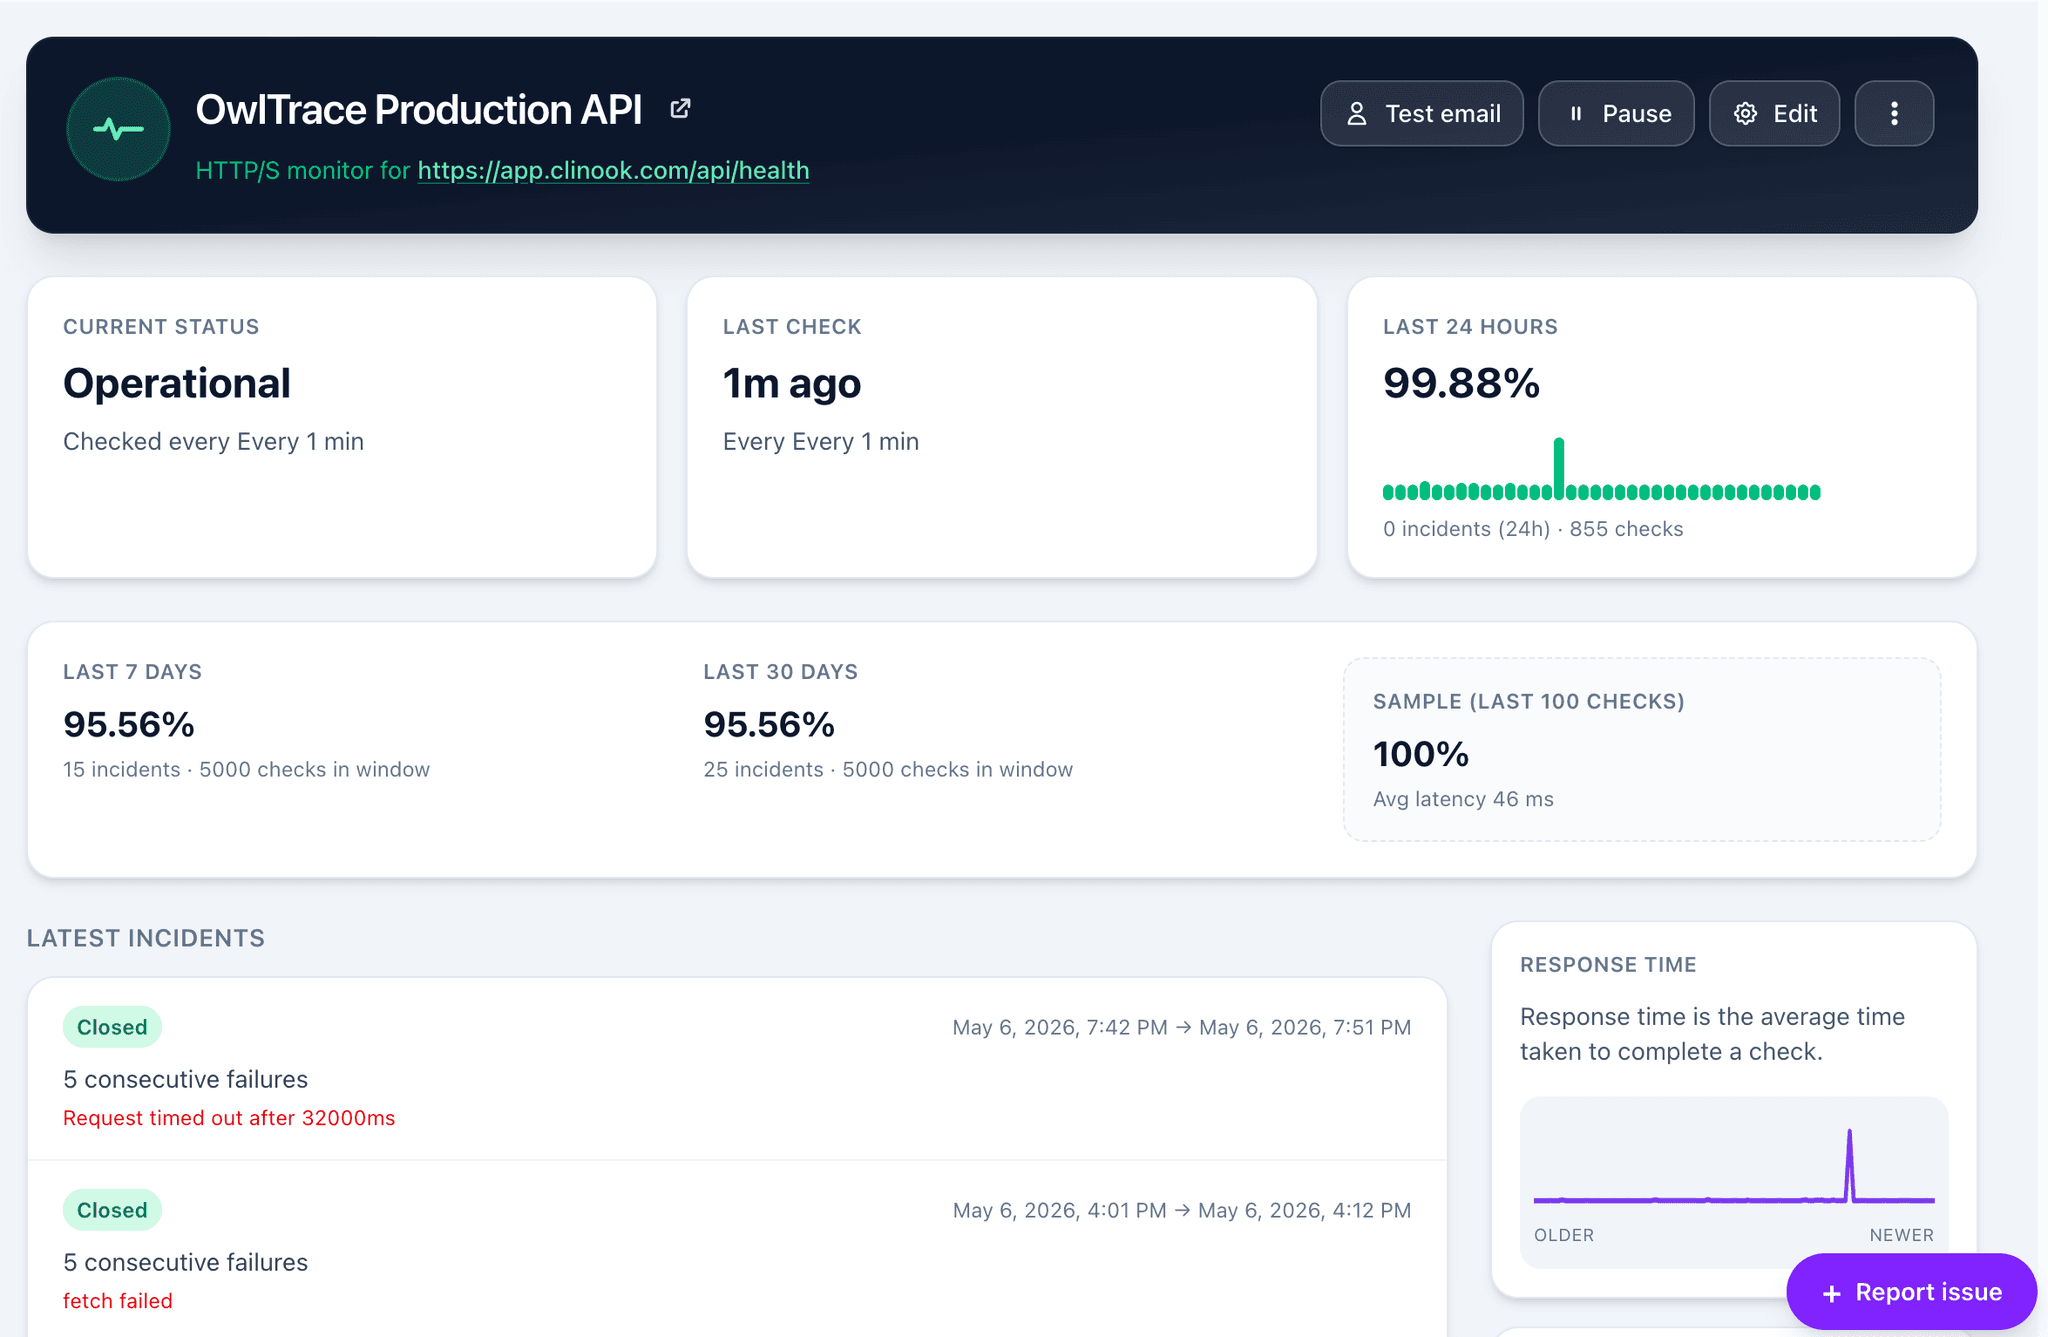
Current status
Operational
Check every 1 min
Last 24 hours
99.88%
0 incidents · 855 checks
Last 30 days
95.56%
25 incidents · 5,000 checks
Avg latency
46 ms
Sample of last 100 checks
Live status at a glance
See the current state of every monitor, last check time, and the rolling sparkline for the last 24 hours — all on one dashboard.
Uptime windows that matter
24-hour, 7-day, and 30-day uptime percentages calculated from real check counts — perfect for SLA reviews and customer reports.
Incident timeline
Every incident is logged with start/end timestamps and the exact failure reason — timeouts, 5xx errors, fetch failures, you name it.
Response time
See exactly how long your API takes
Drill into the latency graph to compare this week vs last week, spot slow checks instantly, and inspect the exact HTTP status, latency, and details for every probe in the underlying log.
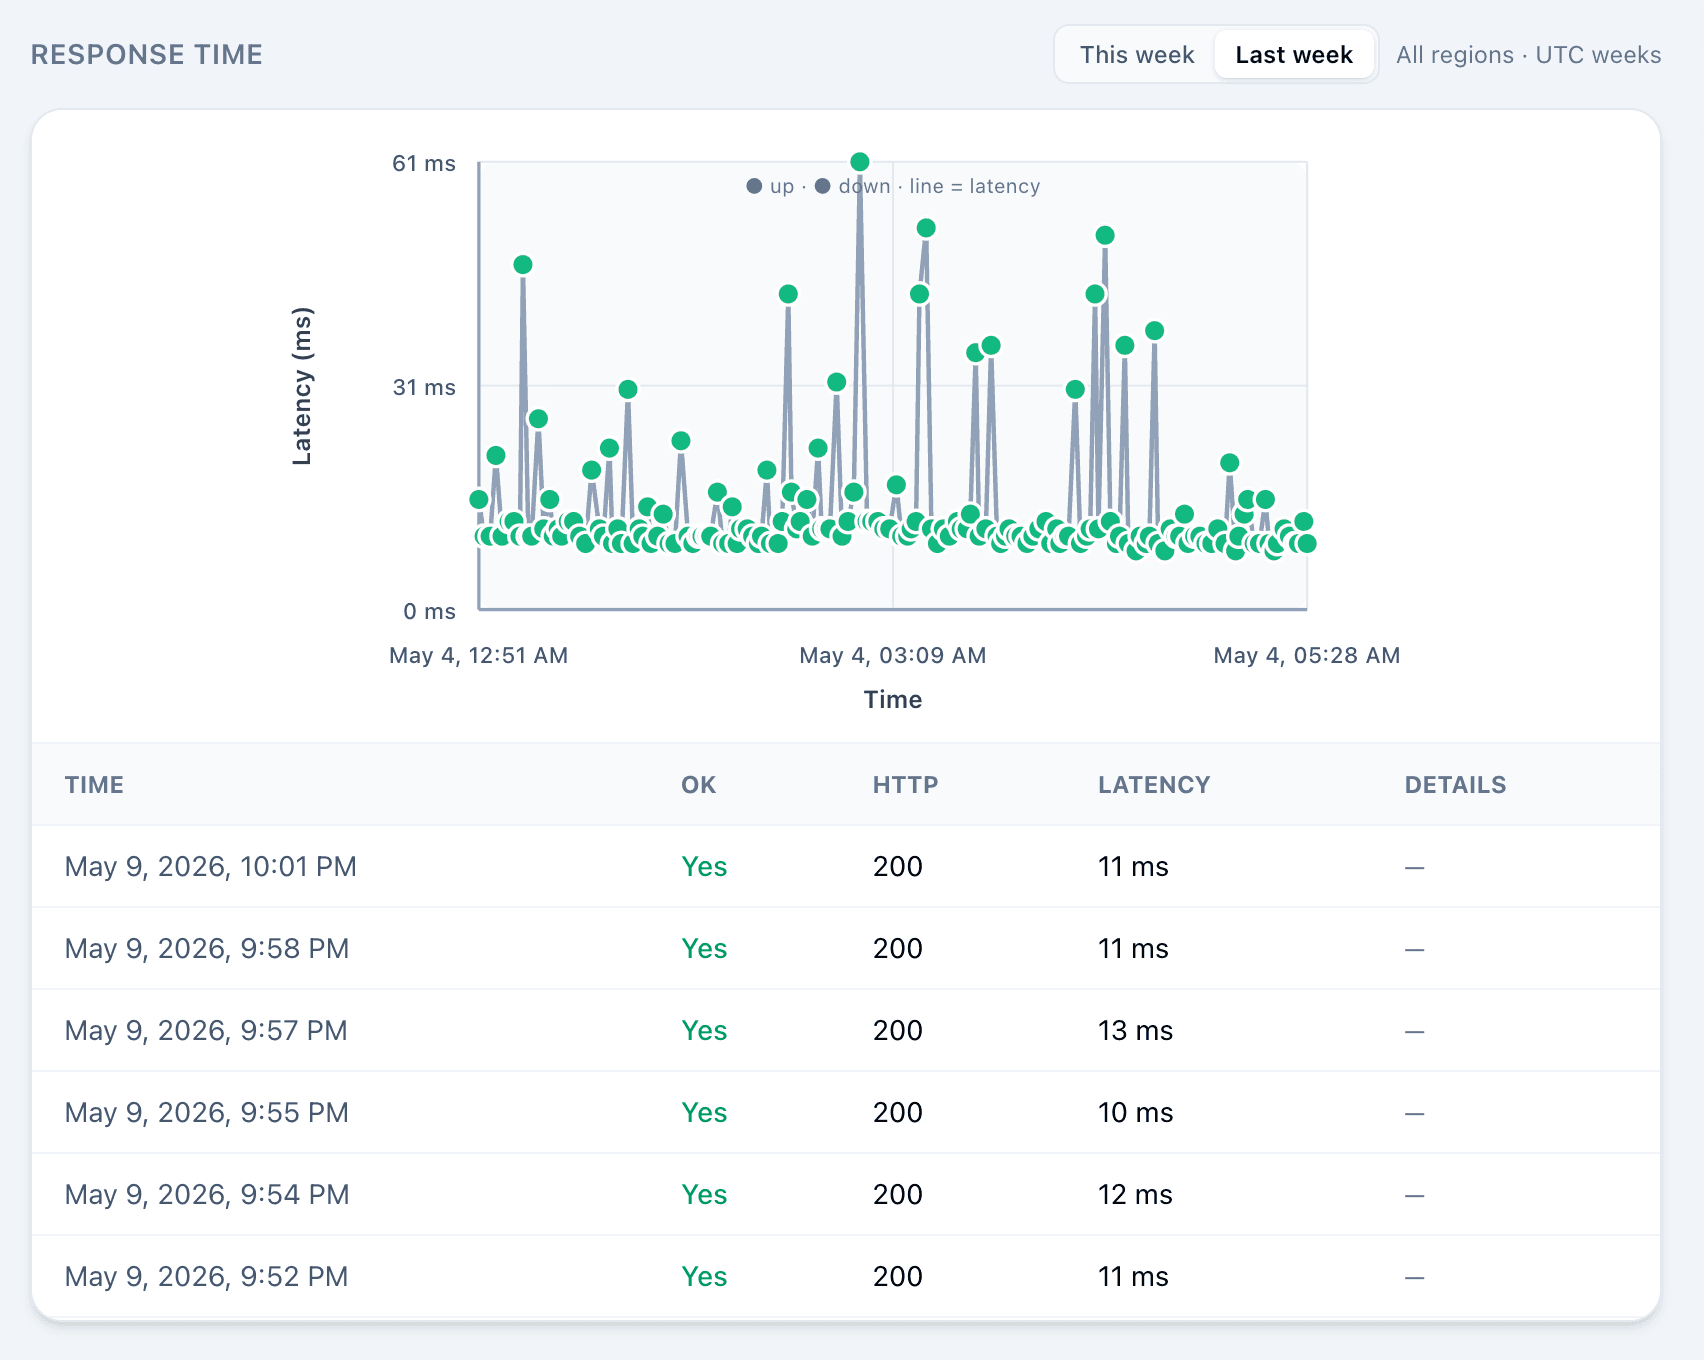
Per-check latency, plotted
Every single check is rendered on the chart so you can spot slow regions, deploy spikes, and the noisy outliers that average graphs hide.
Detailed check log
Drill into the table to see HTTP status, latency in ms, and any error details for every probe — with timestamps down to the second.
This week vs last week
One-click comparison so performance changes after a release or infra migration are obvious instead of buried in raw data.
Start monitoring in under a minute
Add a URL, pick an interval, choose your alert channels. Owl Ping does the rest — forever, on the free plan.